The Cigna Group is one of the largest diversified healthcare services companies globally, generating ≈$275bn in revenue and ≈$8bn in adjusted operating income. The company serves over 180 million customer relationships across more than 30 countries.
Cigna operates through two primary segments:
Evernorth Health Services (≈75–80% of total revenue)
Evernorth is the core engine of Cigna’s business, encompassing:
- Pharmacy Benefit Management (PBM)
- Specialty pharmacy
- Care delivery and clinical services
This segment generates the majority of revenue and drives long-term growth.
Cigna Healthcare (≈20–25% of total revenue)
This segment includes:
- Employer-sponsored insurance
- Stop-loss insurance
- International plans
Cigna has strategically reduced Medicare Advantage exposure, focusing instead on more stable commercial markets.
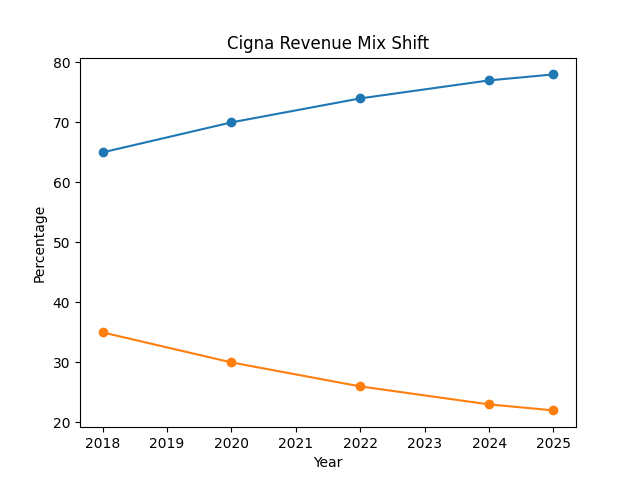
Cigna Revenue Mix Shift Over Time
Why this is important:
This chart shows that Cigna is no longer primarily a traditional insurance company. It has structurally shifted toward its services-driven segment.
What it shows:
Evernorth has grown to nearly ~80% of total revenue, meaning the company is now predominantly a healthcare services platform.
Bottom line: The market still values Cigna like an insurer—but it has already transitioned into a services-driven business.
Revenue Model (How Cigna Actually Makes Money)
Cigna operates a hybrid model:
- Insurance → collects premiums, pays claims
- Services → earns fees, spreads, and pharmacy margins
Example:
- Employer hires Cigna
- Employee fills a prescription
- Evernorth negotiates pricing
- Cigna processes and earns margin
Cost Structure
- Medical costs (~80–85%)
- Pharmacy costs (rising due to specialty drugs)
- Administrative and compliance costs
Healthcare is a low-margin, high-volume business where scale drives profitability.
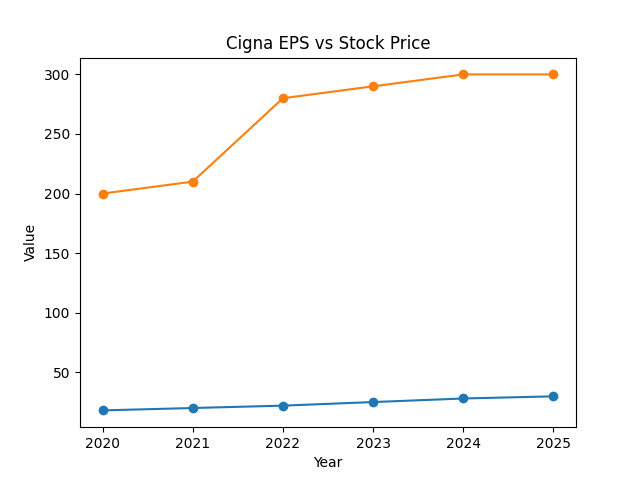
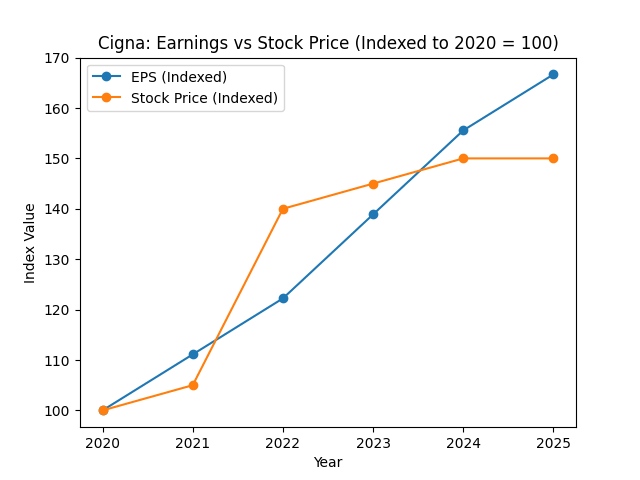
Earnings Growth vs Stock Price
Why this is important:
This is the core mispricing chart.
What it shows:
Cigna’s earnings have steadily increased, but the stock price has remained relatively flat. This divergence reflects valuation compression rather than weakening fundamentals.
Bottom line: The market is pricing regulatory fear, not actual earnings performance.
Backdrop
PBM Regulatory Pressure
The U.S. government is increasingly scrutinizing PBMs over pricing transparency and rebate structures.
Industry Cost Inflation
Healthcare utilization has increased across the industry, pressuring margins.
Growth Normalization
Revenue growth has slowed from ~11% toward a more sustainable ~3–5% range.
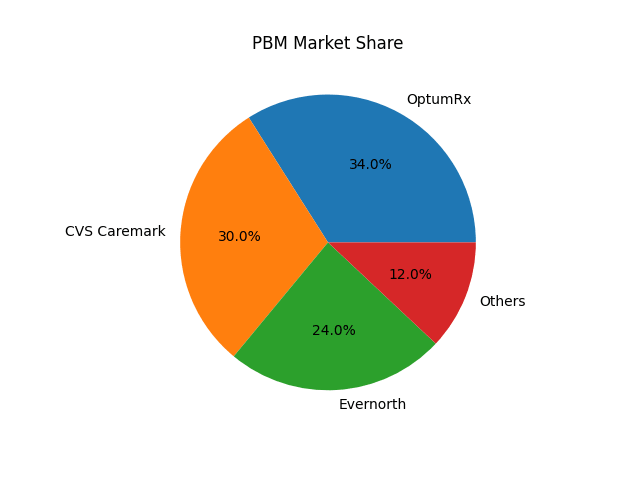
PBM Market Structure (Oligopoly)
Why this is important:
This chart explains why regulatory fears are likely overstated.
What it shows:
The PBM industry is dominated by three players:
- UnitedHealth Group (OptumRx)
- CVS Health (Caremark)
- Evernorth (Cigna)
Bottom line: Regulation may compress margins, but it is unlikely to displace the dominant players.
Set-Up
Cigna is transitioning from a traditional insurance model into a healthcare services platform.
This shift results in:
- more recurring revenue
- greater scalability
- reduced insurance volatility
At the same time, regulatory concerns are suppressing valuation.
Stock Pitch: The Cigna Group (NYSE: CI)
Executive Summary
Cigna is a large-cap healthcare company trading at a discount due to regulatory concerns surrounding PBMs.
Despite this, it maintains:
- strong earnings growth
- a dominant services platform
- durable demand
Rating: Buy
Upside Drivers
Evernorth Growth
Driven by specialty drug demand and high client retention.
Business Mix Improvement
Reduced Medicare exposure and increased focus on services.
Earnings Expansion
EPS continues to grow steadily.
Scale Advantage
Cigna benefits from significant negotiating leverage.
Valuation Comparison: Cigna vs Peers
| Company | P/E | EV/EBITDA |
| Cigna | ~11–12x | ~7–8x |
| UnitedHealth | ~18–20x | ~12–13x |
| CVS Health | ~9–10x | ~6–7x |
| Elevance | ~14–16x | ~9–10x |
Why this is important:
This highlights the valuation gap.
What it shows:
Cigna trades at a discount despite comparable earnings quality.
Bottom line: If sentiment normalizes, the stock has room to re-rate higher.
Management Overview
CEO: David Cordani
- Long-tenured leader
- Architect of the Evernorth strategy
Focus:
- expanding services
- improving efficiency
- managing regulatory exposure
Risks
- PBM regulation
- drug pricing pressure
- slower growth
- competition
Why Risks Are Manageable
- PBMs remain essential to the healthcare system
- scale players dominate the market
- diversified revenue reduces risk concentration
- strong cash flow provides stability
Current Market Sentiment
Investor sentiment remains cautious, largely driven by regulatory concerns rather than operational weakness.
Why Now?
The key question is not whether The Cigna Group is a strong business—it is whether the current valuation already reflects the risks investors are focused on.
At current levels, the market is pricing in sustained regulatory pressure on PBMs, limited earnings growth, and potential margin compression. However, the underlying fundamentals suggest a different picture.
Cigna continues to generate consistent earnings growth, driven primarily by Evernorth, while maintaining strong client retention and stable demand across its core segments. At the same time, its valuation multiple has compressed relative to both its own historical range and its peers.
This creates a disconnect where:
- earnings are growing
- the business mix is improving
- but the stock is not re-rating
In effect, investors are paying a discounted multiple for a business that is becoming more scalable, more recurring, and less dependent on traditional insurance economics.
What Would Break the Thesis?
While the current setup is attractive, there are clear scenarios where the investment case would deteriorate.
- Aggressive PBM Regulation:
If legislation materially eliminates rebate structures or significantly compresses PBM spreads, Evernorth’s profitability could be structurally impaired. - Sustained Margin Compression:
If rising medical or pharmacy costs outpace pricing power, Cigna’s margins could remain under pressure for longer than expected. - Client Losses at Evernorth:
The business relies on large employer and payer relationships. A meaningful loss of major clients would negatively impact revenue stability. - Unexpected Utilization Spikes:
A sharp increase in healthcare utilization could pressure the insurance segment’s cost structure.
These risks are not currently playing out at scale, but they represent the key variables to monitor.
Unit Economics of Evernorth
Evernorth Unit Economics (What Actually Drives Profitability)
Evernorth’s economics are fundamentally driven by per-member and per-script monetization, not just aggregate revenue.
- Estimated scripts processed annually: ~1.6–1.8 billion
- Estimated revenue per script: ~$60–80
- Estimated gross profit per script: ~$3–5
This implies:
- Every incremental 100 million scripts ≈ $300–500 million in gross profit
- Volume growth alone can drive meaningful earnings expansion even without pricing increases
Why this matters:
Evernorth is a volume-driven compounding machine. Even modest increases in utilization translate into large absolute profit gains due to scale.
Bottom line: Growth doesn’t need to come from pricing—it comes from throughput.
Specialty Drug Exposure
Specialty Drug Leverage (Hidden Growth Engine)
Specialty drugs now account for:
- ~50%+ of total U.S. drug spend
- but only ~2–3% of total prescriptions
Cigna, through Evernorth, is heavily exposed to this segment.
Key dynamics:
- Specialty drugs grow ~10–15% annually
- Margins per script are significantly higher than traditional drugs
- Requires complex management → increases PBM relevance
Why this matters:
Even if total prescription growth slows, mix shift alone drives revenue and margin expansion.
Bottom line: Cigna is levered to the fastest-growing, highest-value part of healthcare.
Implied Market Expectations
What the Market Is Pricing In
At ~11–12x earnings, the market is implicitly assuming:
- Low-single-digit long-term earnings growth (~2–4%)
- Limited margin expansion
- Sustained regulatory pressure on PBMs
However, historically:
- Cigna has delivered ~7–10% EPS growth
- Evernorth continues to grow above GDP + inflation
Why this matters:
The current valuation assumes a structural slowdown that has not materialized.
Bottom line: You are being paid to bet that growth remains normal—not exceptional.
Margin Structure Insight
Margin Composition: Insurance vs Services
Cigna’s blended margins hide two very different businesses:
- Insurance margins: ~3–5%
- Evernorth (services) margins: ~5–7%+ at scale
But critically:
- Insurance margins are capital-intensive and volatile
- Services margins are scalable and recurring
As Evernorth grows:
- blended margins stabilize
- earnings become more predictable
Why this matters:
Even without margin expansion, earnings quality improves, which should command a higher multiple.
Bottom line: This is a quality re-rating story, not just a growth story.
Client Concentration + Stickiness
Client Retention and Revenue Stability
Evernorth maintains:
- >97% client retention rates
- Multi-year contracts with large employers and insurers
Switching costs are high due to:
- operational integration
- data systems
- pharmacy networks
Why this matters:
Revenue is extremely sticky, making forward earnings more predictable than typical “growth” companies.
Bottom line: This behaves more like infrastructure than a discretionary service.
Cash Flow Power
Free Cash Flow Generation
Cigna generates:
- ~$7–9 billion in annual operating cash flow
- Strong conversion from earnings to cash
Capital allocation:
- aggressive share buybacks
- consistent dividend growth
Why this matters:
Even if the multiple doesn’t re-rate immediately, shareholder returns continue compounding internally.
Bottom line: You’re not relying solely on market sentiment—you’re getting paid while you wait.
Regulatory Reality Check
PBM Regulation: Real Risk vs Perceived Risk
While PBM reform is a major headline risk, the practical outcomes are likely to be:
- Increased transparency
- Some compression in rebate structures
- But continued reliance on PBMs as cost managers
Important constraint:
- U.S. healthcare system relies on PBMs to control drug costs
- Eliminating PBMs would increase system-wide costs
Why this matters:
Regulation is more likely to reshape economics than destroy the business model.
Bottom line: The market is pricing existential risk where structural importance exists.
“Quiet Compounding” Insight
The Quiet Compounding Dynamic
Cigna is not a high-beta, narrative-driven stock.
Instead, it compounds through:
- incremental volume growth
- stable contracts
- disciplined capital allocation
Over time:
- earnings grow steadily
- shares outstanding decline
- intrinsic value increases
Why this matters:
This is not a “story stock”—it is a cash-generating compounder trading at a discount.
Bottom line: The opportunity is not explosive—it is asymmetric.
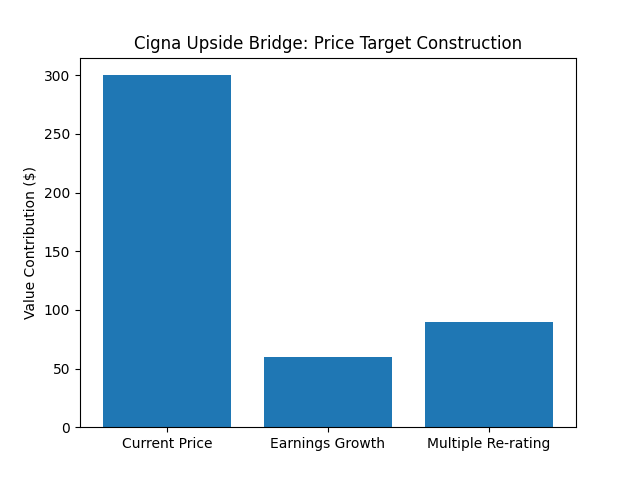
Valuation Upside Scenario
At current levels, Cigna trades at approximately ~11–12x forward earnings, which is below peers such as UnitedHealth Group and Elevance Health.
Assuming:
- forward EPS of ~$30
- a modest re-rating to ~14–16x earnings (still below best-in-class peers)
This implies a valuation range of approximately $420–$480 per share over the medium term.
This does not require:
- aggressive growth assumptions
- margin expansion beyond historical norms
It simply requires:
- stabilization in regulatory sentiment
- continued execution in Evernorth
The upside is therefore driven primarily by multiple normalization rather than fundamental transformation.
Competitive Positioning
Cigna occupies a distinct position within the healthcare landscape.
- UnitedHealth Group operates the most integrated and highest-quality platform, commanding a premium valuation multiple.
- CVS Health has faced execution challenges and margin pressure, leading to a discounted valuation.
- Elevance Health remains more heavily exposed to traditional insurance dynamics.
Cigna sits between these models:
- it has a scaled services platform through Evernorth
- it has reduced exposure to volatile insurance segments
- yet it trades at a discount to higher-quality peers
This positioning creates a scenario where the company benefits from structural tailwinds, but its valuation does not yet reflect them.
Capital Allocation
Cigna has historically maintained a disciplined approach to capital allocation.
Key priorities include:
- Share Repurchases: returning capital to shareholders and supporting EPS growth
- Dividend Payments: providing consistent income while maintaining flexibility
- Debt Management: maintaining a reasonable leverage profile relative to cash flow
Strong and consistent operating cash flow allows the company to:
- reinvest in Evernorth
- pursue strategic growth initiatives
- return capital without compromising balance sheet stability
This reinforces the overall investment case by supporting both growth and shareholder returns.
How Cigna Compounds Over Time
Over the long term, Cigna’s growth is driven by a combination of structural and operational factors.
- Specialty Drug Expansion:
Continued growth in high-cost, complex therapies increases demand for Evernorth’s services. - Client Retention and Expansion:
High retention rates and cross-selling opportunities support steady revenue growth. - Platform Integration:
Combining insurance, pharmacy, and care services increases efficiency and customer stickiness. - Operating Leverage:
As scale increases, incremental revenue flows through at higher margins within the services business.
Together, these factors create a compounding effect where revenue growth, margin stability, and capital returns reinforce each other over time.
Key Catalysts
Several near- to medium-term catalysts could drive a re-rating in the stock.
- Regulatory Clarity:
Reduced uncertainty around PBM regulation would remove a major overhang. - Earnings Consistency:
Continued earnings growth and stable margins would reinforce investor confidence. - Multiple Expansion:
As sentiment improves, valuation could move closer to peer levels. - Capital Returns:
Ongoing share repurchases and dividends provide additional support for the stock.
These catalysts are not speculative—they are tied to observable developments in the business and the broader regulatory environment.
Bottom Line
Cigna is a high-quality healthcare company trading below intrinsic value.
The market is overestimating regulatory risk and underestimating long-term earnings durability.
This creates a clear opportunity for re-rating.
DISCLAIMER
This analysis is not investment advice and reflects opinion only.
© 2026 MacroHint.com. All rights reserved.
This article is proudly sponsored by Lake Region State College.
Michael Lazenby
Editor-in-Chief, MacroHint
Michael Lazenby is the Editor-in-Chief and Founding Partner of MacroHint. He studied economics, business, and government at UT Austin and has hedge fund experience.